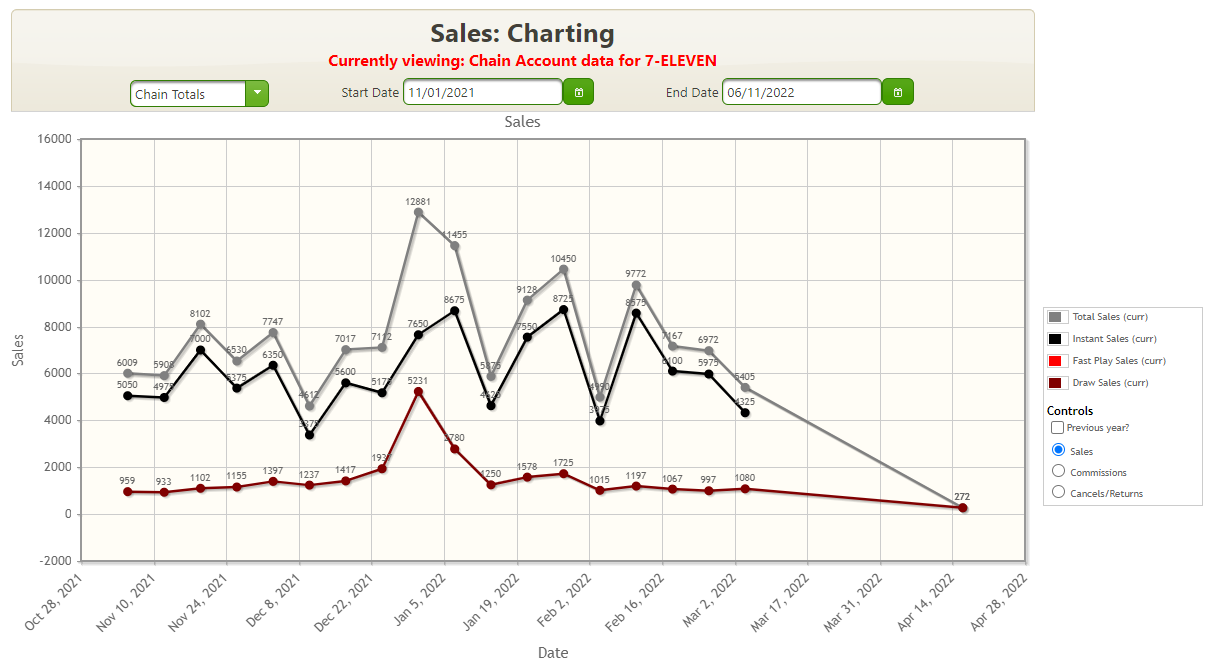
The Charting page displays a graphical representation of sales, commissions, and cancels, which are broken down as Instant, Fast Play, draw, and total sales (the sum of each game type's sales that week).
NOTE: The color of the “Currently viewing:” message below the title of the report will change between blue and red depending on the following:
If only a Chain Account is selected in the Select a Chain Account field, the “Currently viewing:” message displays in red.
If an Agent Location is selected in the Select a Location field, the “Currently viewing:” message displays in blue.
If a Chain Account and an Agent Location are selected, the “Currently viewing:” message displays in blue.
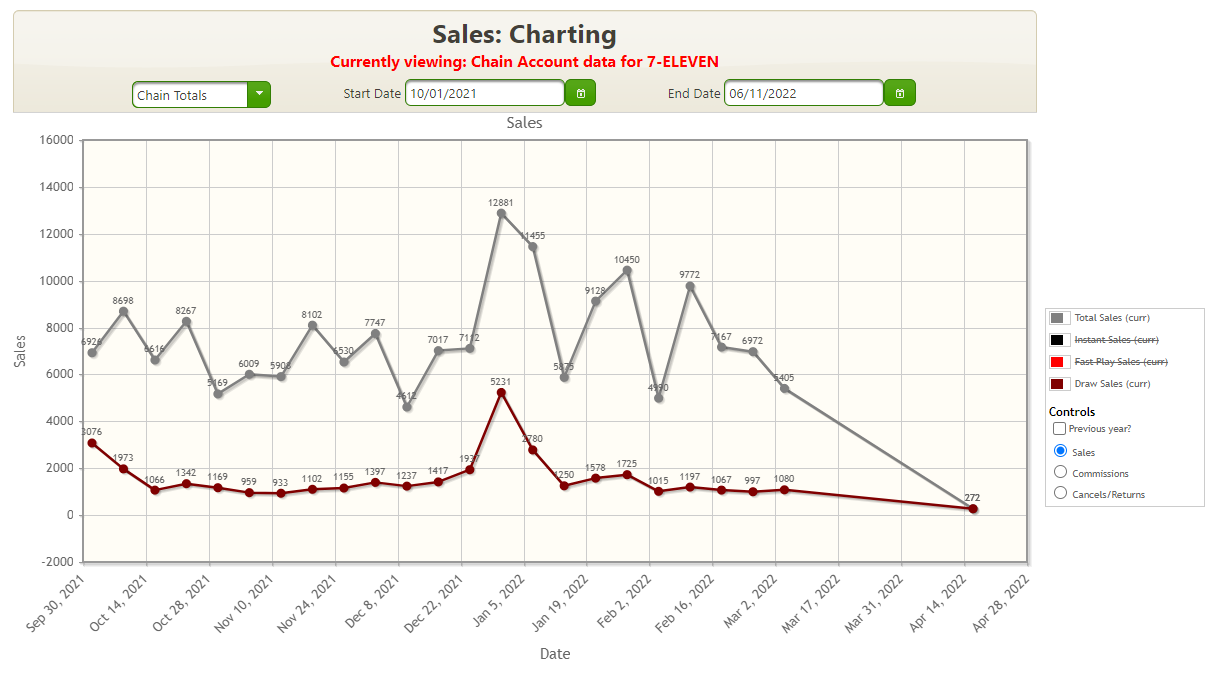
The date range may be selected, but defaults to the previous month.
A check box is provided that allows a simple comparison with the same date range in the previous year.
The current view is displayed in the header below the chart title.
The chart is user-interactive, and data lines may be turned on and off by clicking on their representation within the key to the right. In this way, the user may view representations of specific data lines, or comparisons of single categories.
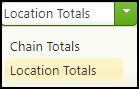
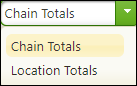
Display totals by agent location
Display data for a different time period
Compare current data with the previous year
Add or remove data lines from the chart
 next to the